
Systems thinking
Examples of causal loop diagrams (CLDs)
We would introduce examples of various problem structures found in our society, organizations, daily life, etc., as loop diagrams. Please use these as references for learning loop diagrams.
In addition to introducing in an easy-to-understand manner through our book and seminars held by our company, we also provide an e-mail course "Loop Diagram Knock" (for beginners), from the group company, E's Inc.
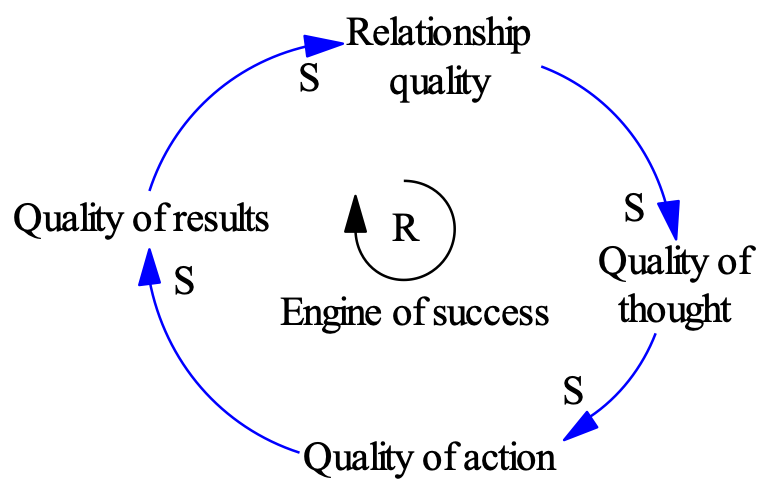
1. The Secret to Success
Have you ever felt that "everything works" when you are doing this as a team, whether it's sports or work? Daniel Kim, in his book "Organizing for Learning," describes the secret to success as follows:
The higher the quality of the relationships between the members of the team, the better the quality of thinking, which in turn improves the quality of action and thus the quality of results. The higher the quality of the results, the higher the quality of the relationships, and the more self-reinforcing loops are formed.
On the contrary, if there is a situation where everything goes wrong, ...
The trust between members is broken, and the quality of thinking deteriorates due to criticism, giving up, other blames, and self-justification. If you do so, the quality of your actions will naturally deteriorate, and you will not be able to obtain good results. The relationship becomes more and more jerky, blaming each other more and more for the lack of good results.
If you think about "quality of results" not only by the number of wins and losses and the number of achievements, but also by whether or not you have accumulated the following, it can be said to be a universal law of success. Is your team going around in a virtuous circle? Or is it going around in a vicious circle?
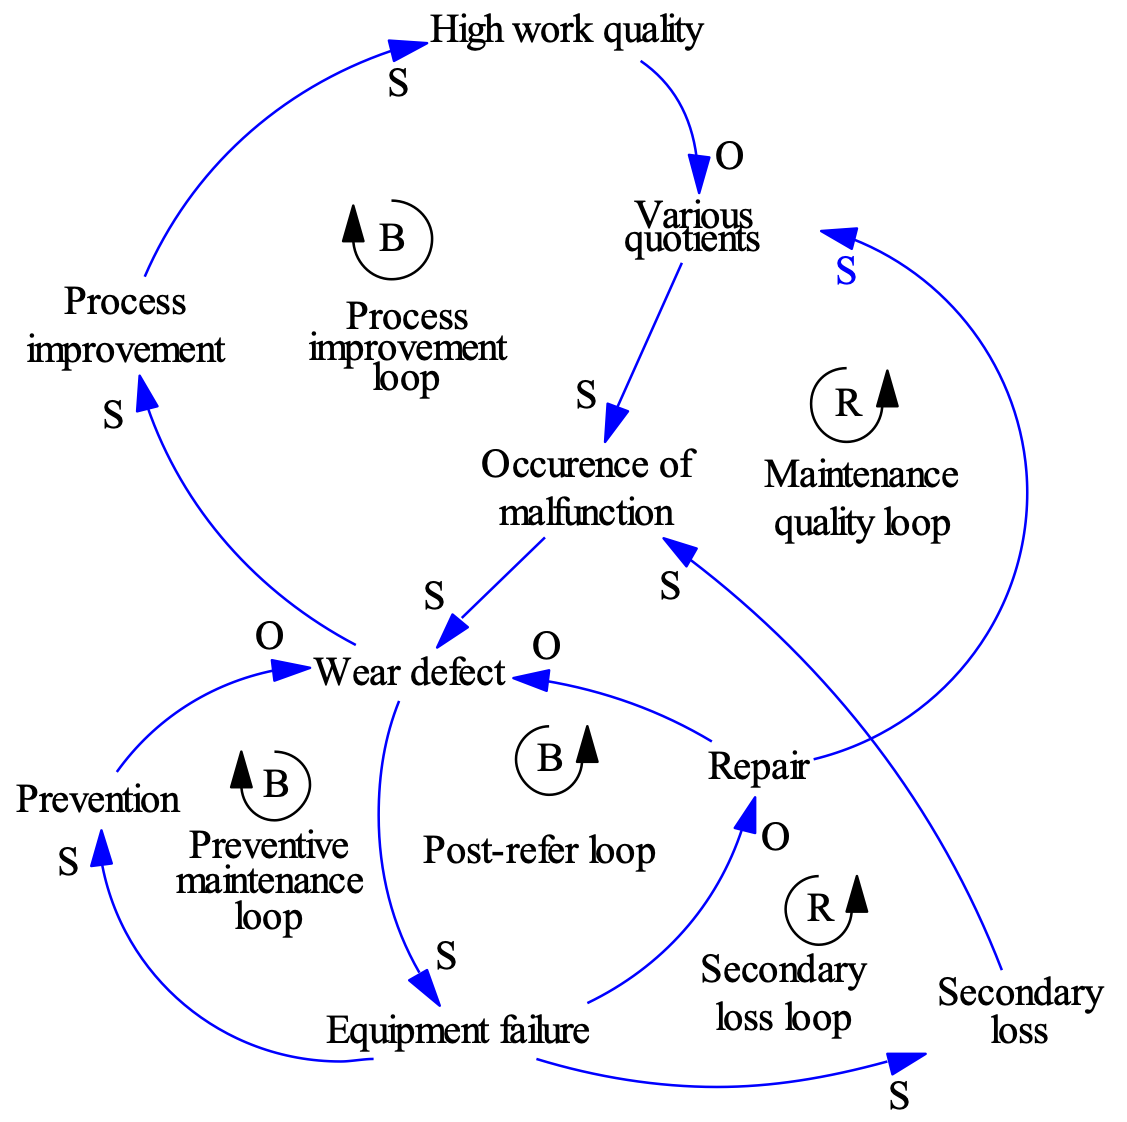
2. Maintenance of factory equipment
Introducing a loop diagram related to "production games" aiming for a world-class factory.
In the equipment industry, high utilization rate and high reliability are important factors that divide competitiveness. Let's take a look at the failure mechanism that causes the utilization rate to drop.
When a device malfunctions and the defects accumulate, a failure will eventually occur. When a failure occurs, the device cannot operate. We will repair it immediately so that production can continue. Then, the defects accumulate when the repairs are worn-out, and the device can be remanufactured.
When failures occur frequently, another countermeasure is preventive maintenance, in which the equipment is inspected prophylactically without waiting for it to fail, and the equipment is adjusted, maintained, and replaced. Preventive maintenance is planned, but it is the same as a failure in that it cannot absolutely prevent malfunctioning of the equipment.
When failures occur frequently, the factory's production schedule is generally tight, and the production department tries to keep the equipment running as much as possible and does not want to arrive at preventive maintenance. However, when it breaks down, there is nothing we can do about it, so we ask the maintenance service department to repair it. In this way, the tendency for post-repair in the factory increases.
One problem with post-repair is that a failure can cause a variety of secondary damages. By continuing an unreasonable operation, other parts will be overloaded, and if the device suddenly stops due to a failure, the impact will create new defects.
In addition, repairs are often done in a hurry so that the equipment could resume operation, and frequent failures could lead to labor shortages, reducing the average quality of work and leaving new defects again during repairs. This is an issue.
Repair problems lead to lower availability and reliability, further lowers sales and raises costs, and maintenance service departments spend most of their personnel and expense budgets on repairs. Then, an organizational culture for ex-post facto will be created.
It goes without saying that it is important to promote planned preventive maintenance even when there are many failures, in order to make the organization more desirable.
Furthermore, if you are aiming for a high-level factory, focus on why defects occur. Defects are caused by various deteriorations in work quality, such as raw material quality, component quality, equipment design quality, operator work quality, and service department engineer work quality. Those defects cause the malfunctioning of the equipment.
Therefore, for a factory aiming for world class impact, it is important to improve the process so that all departments can thoroughly eliminate defects while maintaining high work quality (Organizational culture of company-wide quality control)
A factory full of accidents/hazards is busy with fire extinguishing measures, so preventive maintenance and process improvement are difficult. However, that is exactly what keeps creating the cause of the fire extinguishing.
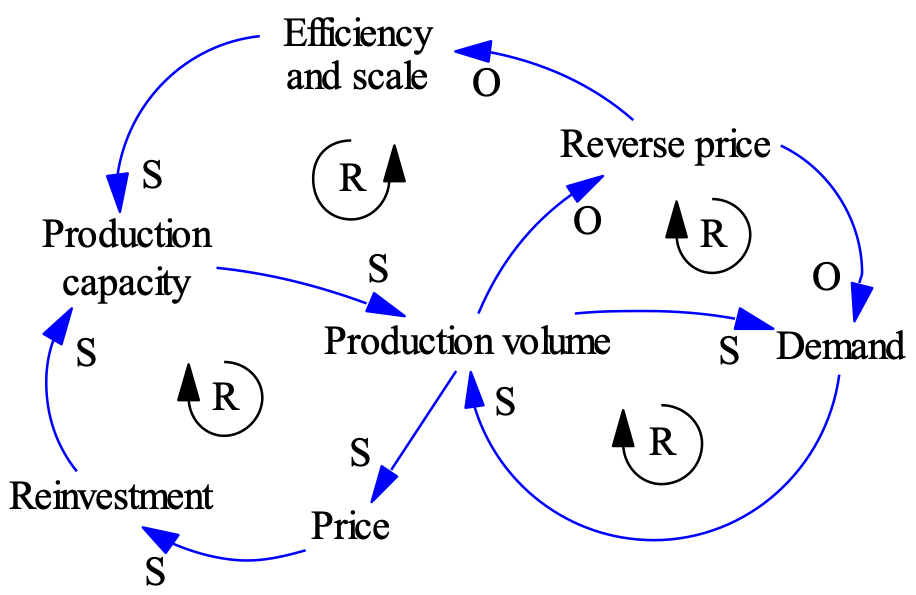
3. World food production system (1)
Over the last 50 years, production has continued to rise in various food sectors, while prices have fallen sharply. What kind of structure creates this pattern?
Increased demand for food (due to population growth and changing tastes) will boost production.
Producers increase production capacity and increase production by reinvesting the profits generated.
Producers with increased production will increase demand through efforts such as marketing. In addition, fierce competition between producers will lower prices and further stimulate demand.
Originally, lower prices should curb supply, but that is not the case in agriculture around the world. This is because there are subsidies, income compensation from side jobs, and barriers to conversion to alternative crops.
Producers increase efficiency and scale to accommodate price declines. As a result, production capacity has increased further, production has increased, and a vicious cycle has been created that leads to further price declines.
In this way, production continues to rise and prices continues to fall.
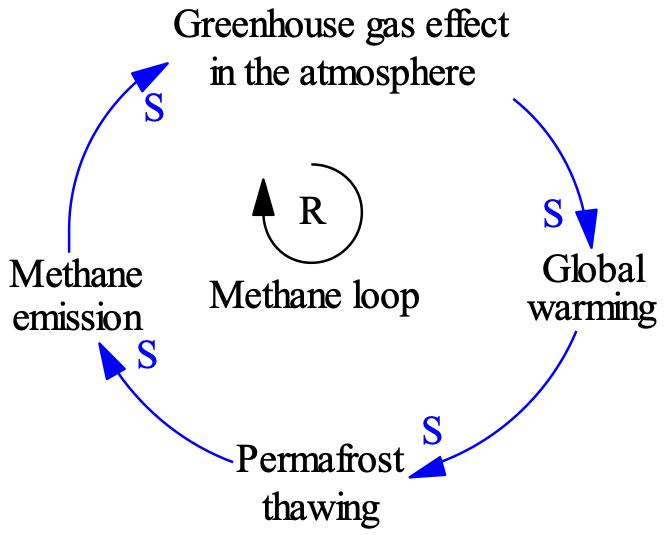
4. Permafrost and warming
As warming progresses and the temperatures rise, permafrost such as Siberia begins to thaw. A large amount of methane is trapped in the permafrost, but the methane will be released into the atmosphere more and more, and the greenhouse gas concentration will increase. In other words, global warming would further increase.
5. Traffic jams and road construction
When traffic jams occur repeatedly, citizens request to alleviate the traffic jams, and governments and politicians try to alleviate the traffic jams by constructing roads.
However, it would be possible to go to places that were not in the commuting area until then, and the developer would develop the residential land. The traffic volume would increase due to the influx of new population and the commuting of suburban residents to work by car.
In this way, in the medium to long term, traffic volumes would increase more than the increase in capacity, and traffic congestion in urban areas would worsen.
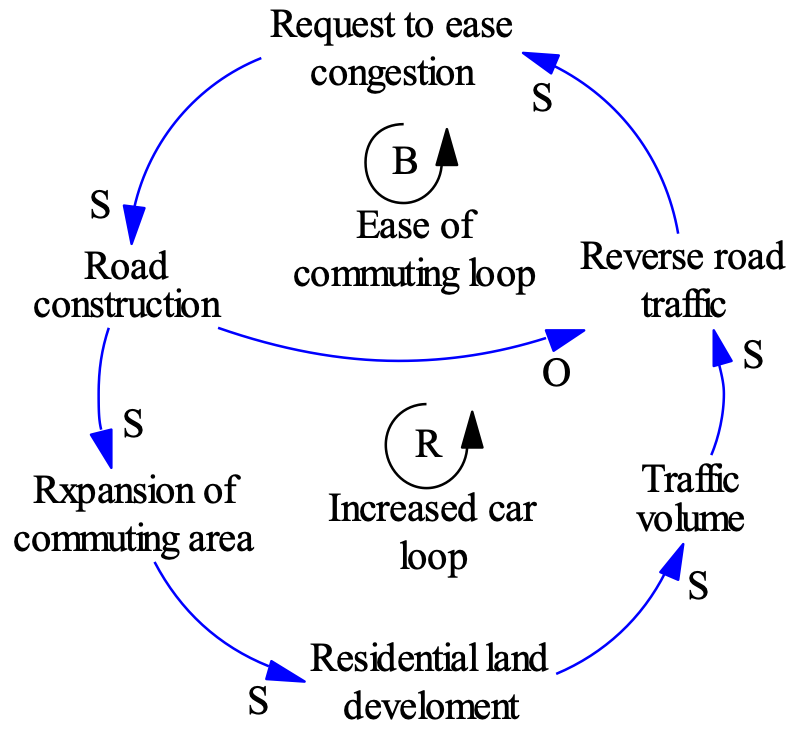
What kind of policy do you propose from this structure?
What kind of feedback would you give if you take into account your connection to public transport?
* This loop diagram is drawn to explain the basic structure of the pattern of long-term deterioration of traffic congestion in many cities around the world that were the subjects of research. We have deliberately omitted other important variables and feedback. In addition, not all road congestion is explained universally, so the structure will differ depending on the congestion situation seen in each region.


